2. Current Situation
Initially the current situation has to be assessed. This ensures that resistance training is beneficial rather than harmful, especially to those individuals with pre-existing injuries or illnesses. This step additionally helps the design of an appropriate training (and nutritional) program. It includes:
- Medical (health) checkup.
- Body measurements.
- Strength measurements.
- Physical characteristics and genetics.
Medical checkup
Usually exercise improves health (see Preface) but some medical conditions might not allow specific types of exercise (e.g. high intensity of effort for persons with high blood pressure or cardiovascular disease, running for overweight persons with low cardiorespiratory fitness etc.).
Initially a self-guided screening for physical activity program is recommended. The Physical Activity Readiness Questionnaires (PAR-Q or the more detailed PAR-Q+) are simple self-screening tools that can and should be used by anyone who is planning to start an exercise program (CSEP 2002, PAR-Q+ 2017). They are designed to identify major symptoms of cardiovascular, pulmonary, or metabolic diseases or orthopedic conditions. Online or printed forms can be found at PAR-Q+ (2017). If any of those conditions apply, the trainee should seek advice from a doctor.
The medical checkup includes a visit to the doctor where the overall health will be assessed. Points that need to be considered include: History and current medical issues regarding heart (blood pressure, chest pains, fainting), lungs (asthma, allergies, difficulty breathing), blood (diabetes, cholesterol, iron), bones or joints. Blood and urine exams and blood pressure measurement are also recommended. At this point it should be clear whether exercise is allowed and under what constraints, or whether exercise should be medically supervised.
Body measurements
The body measurements are the starting point for the goal-setting procedure, and will also provide information about the effectiveness of the programs.
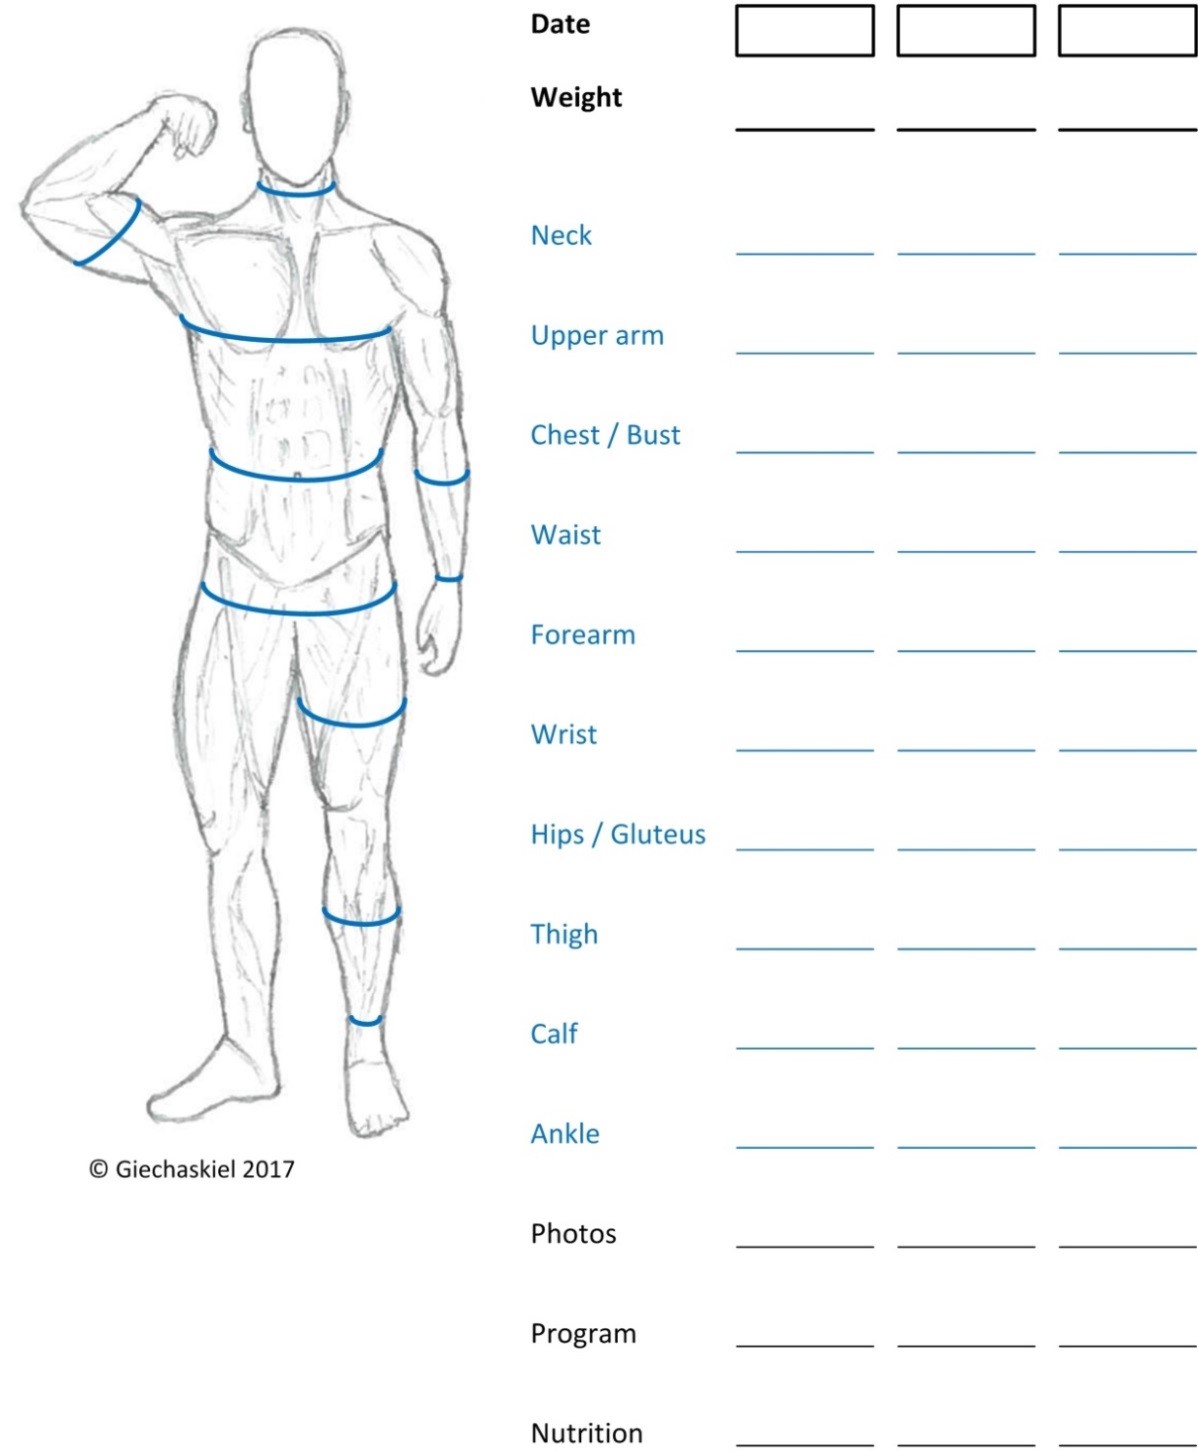
Figure 2.1: Body measurements chart.
They can also identify issues with asymmetry or muscle atrophy. Table 2.1 describes how to take the body measurements. Photos at this stage are very important as they can be used to periodically check progress. The photos should be taken in a swimsuit and always with the same camera at the same location, position, and distance and with the same lighting. Figure 2.1 shows schematically where to take the measurements and also provides a template to register the measurements.
It is recommended to take measurements of both left and right body parts periodically to confirm that any muscle asymmetry is decreasing.
Table 2.1: Body measurements / circumferences (in cm), body mass and fat-free mass (in kg) and body fat percentage (%).
| Part | Description |
|---|---|
| Height [H] | Without shoes |
| Wrist | Measured on the hand side of the styloid process. The styloid process is the bony lump on the outside of the wrist. |
| Ankle | Measured at the smallest part |
| Waist | Measured at its narrowest part width-wise, usually just above the navel (without pulling the waist in). |
| Neck | Measured below Adam's apple at smallest point. |
| Upper arm | Measured around fullest part. Flexed. |
| Forearms | Fist clenched, hand out straight, measured at largest part. |
| Thighs | Measured around the fullest part of the upper leg while standing. |
| Hip (gluteus) | Measured around the widest part of the hipbones. Gluteus (buttocks) is included. |
| Calves | Standing relaxed, measured at largest point. |
| Chest (Bust) | Without shoes |
| Lat spread | Measured all the way around the bust and back on the line of the nipples, flexing and spreading the lats. |
| Body Mass [BM] | Wearing only underwear. |
| Fat-Free Mass [FFM] | FFM=BM × (1-BF%) |
| Body Fat percentage [BF%] | See formula BF%. |
There are different ways to measure body fat including skin fold testing, bioelectrical impedance, DEXA (Dual Energy X-ray Absorptiometry) scan and hydrostatic weighing. If there is no access to any of those methods, internet calculators (Calculator.Net 2008) or the formulas below (Hodgdon and Beckett 1984a&b) can be used. The key for progress is consistency and continuity with the methods used (e.g., every 2-4 weeks using the same formula). Definitions of fat-free mass and the body composition of the reference man (Snyder et al. 1975) are given in Table 2.2.
The formula to estimate the percentage of Body Fat (BF%) based on waist, hip and neck circumferences (in cm) and height (H, in cm) for men and women are given below (Hodgdon and Beckett 1984a&b):
BF%men = 495 / {1.0324 - 0.19077 × [log(waist-neck)] + 0.15456 × [log(H)]} - 450
BF%women = 495 / {1.29579 - 0.35004 × [log(waist+hip-neck)] + 0.22100 × [log(H)]} - 450
Table 2.2: Body composition of the reference man (Snyder et al. 1975). The major components of each functional part are also given. The last columns give lean-body mass and fat-free mass definitions.
| Functional | Body | Tissue | Molecular | Simplified | Simplified |
|---|---|---|---|---|---|
| Adipose mass | 21% | 80% | non-essential fat | non-essential fat mass | Fat mass |
| 10% | essential fat | Lean-body mass (LBM) | |||
| Muscle mass (skeletal) | 40% | 79% | water | Fat-free mass (FFM) | |
| 17% | protein | ||||
| 1% | glycogen | ||||
| Bone | 7% | 54% | mineral | ||
| 26% | protein | ||||
| Blood | 8% | 80% | water | ||
| Other | 24% | 65% | water |
Strength measurements
Table 2.3 contains the main exercise recommended to be tested with 6 repetitions; the lowest number of repetitions recommended in this book. The reason to use 6 repetitions and not one, is that: (i) the absolute strength (one repetition maximum 1RM) is not important in evaluating progress, (ii) the determination of 1RM is time consuming and might not be accurate for untrained persons, (iii) the 1RM testing has a higher risk and can lead to injuries. For those interested in the 1RM, formulas predict that the 1RM should be 10-20% higher than the 6RM depending on the person, its sex, and the exercise (upper or lower body, single- or multi-joint) (Mayhew et al. 1992, Reynolds et al. 2006, Richens and Cleather 2014). See also Table 1.2. The strength increase (in percentage) when exercising at the repetition range 2RM to 10RM translates to similar increase of 1RM (Pereira and Gomes 2007, Carpinelli 2011), but this might not be true for higher than 30RM (Mitchell et al. 2012a). For example, a 10% increase in 8RM with training, will probably increase the trainee’s 1RM for that exercise approximately 10% (Carpinelli 2011).
Table 2.3: Strength tests. 6RM: For each exercise, find the maximum weight (resistance) until the 6th repetition cannot be conducted in good form. Start with a light weight and increase it every time until you reach 6 repetitions. The “Resistance / Body weight” ratio can be compared with future targets (Table 3.4).
| Exercise | Exercise Weight (resistance) | Resistance / Body Weight |
|---|---|---|
| Squat (barbell) | ||
| Bent over row (barbell) | ||
| Bench press (barbell) | ||
| Military press (barbell) | ||
| Bicep curl (barbell) | ||
| Dips (extra weight) | ||
| Pull-ups (extra weight) | ||
| Row (one arm) (dumbbell) | ||
| Calf (one leg) (dumbbell) |
Note: The advantage of using the specific exercises is that they require minimum equipment and can be easily tested even if one changes gym. However, one should feel free to replace them, especially considering that many of them are dangerous if the technique is not correct.
Various characteristics
Various characteristics like musculoskeletal leverage, flexibility, hormonal and energy levels, and injuries play an important role on the choices for training. For example, an injury at the back might mean that exercises like row or squat cannot be done with free weights. Reduced flexibility might mean restricted range of motion in some exercises. When designing the training program, all characteristics have to be taken into account. The differences among the people also show that the absolute numbers are of secondary importance and individuals should focus on their physical characteristics.
Somatotypes
In the ‘40s, American psychologist William Herbert Sheldon, categorized the human physique according to the relative contribution of three fundamental elements, somatotypes, named after the three germ layers of embryonic development: the endoderm (develops into the digestive tract), the mesoderm (becomes muscle, heart and blood vessels), and the ectoderm (forms the skin and nervous system). His target was prediction of personality traits based on one's general appearance. It had nothing to do with actual physical improvement. In his 1954 book, Atlas of Men, Sheldon categorized all possible body types according to a scale ranging from 1 to 7 for each of the three “somatotypes”, where the pure “endomorph” was 7-1-1, the pure “mesomorph” 1-7-1 and the pure “ectomorph” 1-1-7. The visual methodology was later developed in equations, which are used in the sports world (Carter and Heath 1990). Based on these equations:
- Endomorphy reflects the amount of subcutaneous fat.
- Ectomorphy relates to the height and weight of body.
- Mesomorphy relates to the relative muscular and skeletal development.
The mesomorphy is given by the following equation (Height, H, in cm):
Mesomorphy = 0.858 × humerus width + 0.061 × femur width + 0.188 × upper arm + 0.161 × calf - 0.131 × H + 4.5
Humerus width is the width between the medial and lateral epicondyles of the humerus when shoulder and elbow are at 90 degrees. Femur width is the greatest distance between the lateral and medial epicondyles with the knee bent at a right angle of the femur. The rest of the measurements should be taken as explained in Table 2.1. For more details see Carter and Heath (1990).
Based on this equation a person can check the current mesomorphy index and can also estimate the maximum (future) index based on the maximum achievable arm and calf sizes (as will be given in Table 3.3).
According to a study on twins (Peeters et al. 2007), additive genetic sources of variance in men explained 28.0%, 86.3% and 66.5% for endomorphy, mesomorphy and ectomorphy, respectively. For women, the corresponding values were 32.3%, 82.0% and 70.1%. Thus, mesomorphy and ectomorphy have high heritability, whereas endomorphy, which represents a relative measure of fat, does not. Thus, improvements of mesomorphy with exercise are relatively small.
Bodybuilders were found to have high mesomorphy (Fry et al. 1991, Ackland et al. 2008, Nikbakhsh et al. 2013) (>6). Endomorphy and ectomoprphy were very low (<1), thus the fat mass was very low and the muscle mass very high compared to height.
Although the importance of somatotypes for sport performance is strongly supported, there are no studies on the effect of various nutritional or training strategies for different somatotypes. According to anecdotal evidence, nutritional and training recommendations for different somatotypes are given in Table 2.4:
Table 2.4: Characteristics of different body types and training recommendations.
| Body type | Ecto | Meso | Endo |
|---|---|---|---|
| Muscle mass | Low | High | Medium |
| Fat | Low | Medium | High |
| Height / weight | High | Medium | Low |
| Shoulder | Narrow | Broad | Medium |
| Hips | Narrow | Medium | Wide |
| Training frequency | Low | Medium | High |
| Training volume | Low | Medium | High |
| Cardio frequency | Low | Medium | High |
| Calories | High | Normal | Low |
Chapter summary
This chapter explained how one can assess his current situation. After a physical activity questionnaire and a medical checkup, the initial body measurements (Figure 2.1) should be taken and then the strength in some basic exercises should be checked (Table 2.3). More advanced trainees could check their somatotypes in order to optimize the design of the training routines (Chapter 6). After the assessment of the current situation, the next step involves goal-setting which is the topic of the next chapter.